Horacio Coutino, Equities investment writer
As we come towards the conclusion of the Q2 earnings season, and the Fed appears to be ever closer to cutting interest rates, there seems to be conflicting beliefs about what is actually happening and what may be happening to the US consumer. The most recent economic indicators depict a resilient US consumer, a still positive employment landscape despite signs of the pace of hiring slowing and the unemployment rate edging up, and moderating inflation.
However, insights gleaned from Q2 earnings calls present a potentially different perspective on the true state of the consumer raising the question of whether US consumer strength reached its peak? The stark differences in perspectives between the reported lagged data and the scenarios corporations and banks are presenting prompts a closer examination of the actual state of the US consumer, potentially revealing areas of vulnerability within the currently, widely accepted macroeconomic context. If there are indeed vulnerabilities, where are they and what kind of portfolio risks do they pose over the short to medium term? Is it appropriate for investors to consider a more defensive position in the event that all is not as it seems on the surface? What would a defensive portfolio entail, and how would it compare against the broader S&P 500?
The affordability edge shifting consumer sentiment
In the aftermath of the Covid-19 pandemic, food companies implemented a series of substantial price increases over a three-year period. Their justification was the need to offset their own escalating costs, coupled with the expectation that consumers would accept higher prices to maintain loyalty to their preferred brands. Consequently, the proportion of US consumers' income allocated to food expenditure reached a three-decade high.
Although the rate of food inflation in supermarkets and restaurants has moderated considerably over the past year, prices for a wide range of food items remain significantly elevated compared to pre-pandemic levels. Data from the Labor Department indicates that fast-food prices in March were 33% higher than in 2019, while grocery prices had increased by 26%.
This sustained price elevation appears to be impacting consumer behaviour. Market-research firm Revenue Management Solutions reported a 3.5% decline in US fast-food traffic during the first three months of this year compared to the same period in 2023. Similarly, NielsenIQ data reveals a 2% decrease in US grocery sales of food and beverages by volume for the 52 weeks ending 20th April compared to the year-ago period.
These trends suggest that consumers are becoming increasingly price-sensitive, potentially leading to shifts in purchasing habits with a greater focus on value as the impact of inflation continues to be felt. This heightened price consciousness is not limited to grocery shops and fast-food chains; it's also evident in the behaviour of consumers at premium brands like Starbucks.
According to market research firm HundredX, Starbucks' customer purchase intent has decreased by 3% in just the six months from last October to April of this year. Furthermore, Starbucks coffee drinkers have expressed a notable decline in satisfaction with the brand's quality and taste, with taste perception falling by 4% over the same six-month period.
These shifts in consumer sentiment are reflected in Starbucks' financial performance. In the US, Starbucks experienced a 7% drop in traffic during Q1, marking its steepest quarterly decline since at least 2010. The company experienced a 2% decline in same-store sales during its latest quarter, marking the second consecutive quarter of decreased sales. The number of orders placed also decreased by 6%. Additionally, profit fell by 7.5% in Q2.
These findings underscore the broader trend of consumers becoming more discerning in their spending habits, seeking value and quality as they navigate a world of permanently higher prices and growing economic uncertainty.
Another example of consumer caution is taking place in what many consider to be an American restaurant staple. McDonald's recently reported its first global sales decline since 2020. The company's comparable sales fell 1% y/o/y in Q2, with declines observed both internationally and in its US home market.
McDonald’s CEO Chris Kempczinski acknowledged that consumers are “more discriminating with their spend.” While the company’s quarterly revenue remained relatively stable y/o/y at $6.49 bn, net profit declined 12% to $2.02 bn, falling short of Wall Street expectations. EPS were $2.80, compared to analysts' forecasts of $3.08.
Kempczinski attributed this decline to the erosion of McDonald's affordability edge, a consequence of price increases implemented in recent years to counter steep inflation. He further noted that consumer sentiment in most major McDonald’s markets is subdued. He observed trends such as increased home dining and a greater emphasis on deal-seeking behaviour among consumers.
The fast-food chain joins a growing list of major brands grappling with the changing dynamics of consumer behaviour. The American consumer, despite seemingly impervious to economic headwinds, appears to be under pressure from stubborn inflation and high borrowing costs and is now exhibiting signs of fatigue. This shift has significant implications for the US economy, where consumer spending accounts for two-thirds of activity.
Mondelez, the manufacturer of Ritz crackers and Chips Ahoy! cookies, provides a further illustration of this trend. Despite touting consumer loyalty as justification for price increases, Chief Executive Dirk Van de Put acknowledged that shoppers are now grappling with reduced food-stamp benefits, higher interest rates, and persistent inflation.
Van de Put noted that the company has “surpassed certain price points,” and this is having an impact on consumer behaviour. He highlighted a shift away from larger “family size” or “party size” packages towards smaller, more affordable options, even if these represent a higher price per unit. Consumers are prioritising affordability, even if it means compromising on quantity.
The fast-food sector's aggressive pricing strategy has eroded its value advantage. Consequently, consumers are adapting their behaviour, either trading up to fast-casual options or opting out of outside dining and insteading opting into groceries to eat at home, where price increases have been less pronounced. These examples collectively paint a picture of a consumer landscape undergoing an albeit gradual, profound transformation. Businesses that have strong pricing power, recurring revenue streams, idiosyncratic catalysts, and superior margin flow-through might benefit from this trend.
How has US retail performed in Q2?
As of 21st August, according to LSEG I/B/E/S data, 158 out of the 199 companies comprising the Retail/Restaurant Index have released their Q2 2024 EPS results, accounting for 79% of the index. Among these companies, 72% surpassed analysts' earnings expectations, while 4% met estimates and 24% fell short. Consequently, the blended earnings growth estimate for Q2 2024 currently stands at 13.9%.
In terms of revenue, the blended growth estimate for the entire index is 3.6% for Q2 2024. Of the companies that have reported thus far, 49% exceeded revenue forecasts, whereas the remaining 51% reported revenue below expectations.
Analysing sub-industries, Broadline Retail stands out with the highest y/o/y earnings growth rate at 84.5%, accompanied by the highest earnings surprise factor of 23.3%. Conversely, the Distributors sub-industry exhibits the lowest earnings growth at -7.5%, coupled with the lowest surprise factor at -3.8%. The overall Retail/Restaurant Index maintains a surprise factor of 8.4%.
In anticipation of Q3 2024, 19 retailers have issued negative preannouncements regarding their EPS, while six have provided positive EPS guidance thus far. Additionally, among those retailers offering revenue guidance, 18 have cautioned about potentially disappointing results, whereas five have indicated the possibility of exceeding previous revenue expectations.
Furthermore, an analysis conducted by LSEG in collaboration with Centric Market Intelligence reveals that discount penetration, which measures the proportion of merchandise on sale, has increased throughout the year. It rose from 28% in January to 37% in August. However, the average discount percentage in August remains consistent with the year's average of 36%, despite the greater volume of discounted merchandise.
Shifting to July's retail sales, a rebound was observed following a contraction in June. The US Census Bureau's report indicated a 1.0% m/o/m increase in sales, with ex-autos sales rising by 0.4% m/o/m, surpassing market expectations. The most significant m/o/m growth was seen in motor vehicles and parts dealers, with a 3.6% increase.
July's retail sales report further underscores the pivotal role of e-commerce in the current consumer landscape. On a y/o/y basis, e-commerce demonstrated the strongest growth, registering a 6.7% increase.
Walmart: a bright spot in US Retail
A prevailing narrative among investors this earnings season suggests that the granular, company-specific information reveals a marked deterioration in consumer health. This perspective is grounded in troubling anecdotal evidence from company commentary, particularly regarding lower-income consumers, as well as slowing and downwardly revised sales forecasts. However, does this perspective align with official economic data? Moreover, does this narrative accurately represent the experiences of all retail companies? Not necessarily.
Walmart reported an impressive eighth consecutive quarter of double-digit e-commerce growth, achieving a remarkable 21.0% increase. During its earnings call, the company highlighted the rapid expansion of its pickup and delivery services, noting that "pickup is growing faster than our in-store or club sales, and delivery is growing even faster than pickup. Delivery, accuracy, and speed continue to improve."
The company also exceeded expectations with a 4.2% increase in comparable sales at Walmart US in Q2, surpassing the 3.5% growth analysts had predicted. Consequently, Walmart has once again raised its full-year guidance, now projecting net sales on a constant-currency basis to grow between 3.75% and 4.75%, up from its previous forecast of 3% to 4%. Additionally, the midpoint of its adjusted EPS guidance has been raised by 4% to $2.39.
Walmart has successfully fulfilled its commitment to achieving faster bottom-line growth than top-line growth. In Q2, total revenue increased by 4.8%, while operating income surged by 8.5%. Over the past six quarters, Walmart's revenue growth has averaged 5.9%, with operating income exhibiting an average growth of 11%. This performance is reflected in its current valuation multiples, with a P/E LTM of 29.1x and an EV/EBITDA of 15.3x.
So what is the state of the US consumer?
With the first half of 2024 behind us, and amidst growing concerns about the US consumer's financial health, we assess the year's progress thus far. Our analysis indicates, on the surface, a generally positive consumer outlook for 2024, with the favourable employment landscape supporting wage and compensation growth and, consequently, disposable personal income (DPI) growth. Despite the impact of persistent high-interest rates and modestly elevated energy costs, the aggregate US consumer maintains a healthy discretionary cash inflow and adjusted discretionary cash flow, a proxy for spending power.

Source: US Bureau of Economic Analysis.
However, a closer examination by income quintile reveals a divergence in trends. Mid and low-income quintiles are projected to experience the lowest discretionary cash inflow growth. This is primarily due to the combined effects of higher financial obligations and reduced mortgage equity withdrawals, which constrain cash inflows for this segment of the population.
A recent study conducted by the San Francisco Federal Reserve provides insights into the deterioration of US consumer wealth across income quintiles, suggesting an overall decline, albeit at varying rates. The study examines the evolution of liquid wealth—assets readily convertible to consumer spending—during the post-pandemic period and its deviation from a "no-pandemic" scenario.
The researchers analysed changes in pandemic-era liquid wealth for two income groups: high-income and middle- to low-income households. Their findings reveal that both groups accumulated and subsequently spent significant amounts of liquid wealth following the onset of the pandemic recession. The rise and fall in household liquid wealth mirrored a decrease and subsequent increase in credit card delinquency rates for both groups.

Source: Board of Governors of the Federal Reserve System, retrieved from FRED, Federal Reserve Bank of St. Louis.
The substantial surge in liquid wealth was most prominent among higher-income households. By early 2021, the top US households by income possessed 11% more liquid assets, equivalent to an additional $1.1 trillion, compared to the pre-pandemic projection. In contrast, middle- and lower-income households in the bottom 80% experienced a peak increase of 6%, or $270 billion, in liquid holdings.
Households across all income levels witnessed a decline in their pandemic-era wealth by the second quarter of 2021, indicating that they began utilising the additional funds accumulated earlier in the pandemic. The study's estimates suggest that middle- and lower-income households depleted their pandemic-era liquid wealth by late 2021, while higher-income households' surplus funds lasted until the second half of 2022.
The latest estimates, extending through the first quarter of this year, reveal that the current level of liquid wealth held by higher-income households is slightly below the pre-pandemic projection (-2%), whereas the level for middle- and lower-income households is significantly lower than projected (-13%).
The recent reduction in liquid assets has coincided with an increase in household debt, which has been steadily rising over the past few years and recently reached record highs, according to the Household Debt and Credit Report by the Federal Reserve Bank of New York (2024).
This suggests that recent consumer spending has been financed by an increase in consumer credit following a substantial decline in liquid wealth and savings. Furthermore, this deterioration has been most acutely experienced by middle- to low-income households.

Source: US Bureau of Economic Analysis.
This observation is especially pertinent considering recent indicators suggesting a decline in consumer sentiment, particularly among lower-income segments. These indicators include a dip in consumer confidence, an increase in credit card delinquencies, a depletion of savings, cautious remarks from corporate management, and a growing consumer preference for value-oriented purchases.
")
Source: University of Michigan, retrieved from FRED, Federal Reserve Bank of St. Louis.
Year-to-date, DPI growth has moderated on a year-over-year basis, with a 3.6% increase in June compared to 4.5% in January. This deceleration is attributed to an increase in tax withholding, which has raised the effective tax rate and offset the absolute increase in wages, salaries, and disbursements.
Meanwhile, consumer credit growth has slowed, although Q2 data shows a slight uptick, albeit still below historical averages. On the employment front, the July employment report indicated a softening in the labour market, with payroll growth experiencing a significant deceleration and the unemployment rate rising to 4.3%.

Source: Board of Governors of the Federal Reserve System, retrieved from FRED, Federal Reserve Bank of St. Louis.
However, more recent data should provide some reassurance that all is not lost in relation to the US consumer, as the employment component of the non manufacturing ISM index re-entered expansion territory for the first time since November 2023, and initial jobless claims have shown a modest decline. Additionally, underlying job gains remain near their breakeven pace at 146,000 per month, and the jobs-workers gap continues to indicate a surplus of approximately 1.1 million open positions compared to the number of unemployed individuals actively seeking employment. This strong labour demand, coupled with continued labour force expansion for the remainder of the year, supports healthy wage inflation, contributing to a positive DPI forecast for the year.
Furthermore, continued pressure from financial obligations throughout 2024 can act as a headwind to consumer spending, as expectations for a rate cut have been pushed further into the year.
What might a defensive portfolio look like?
In the prevailing economic climate, characterised by a resilient yet increasingly vulnerable consumer landscape, investing in consumer-oriented businesses possessing robust pricing power, consistent revenue streams, unique catalysts, superior margin flow-through, and a track record of positive earnings estimate revisions may prove a smart defensive play.
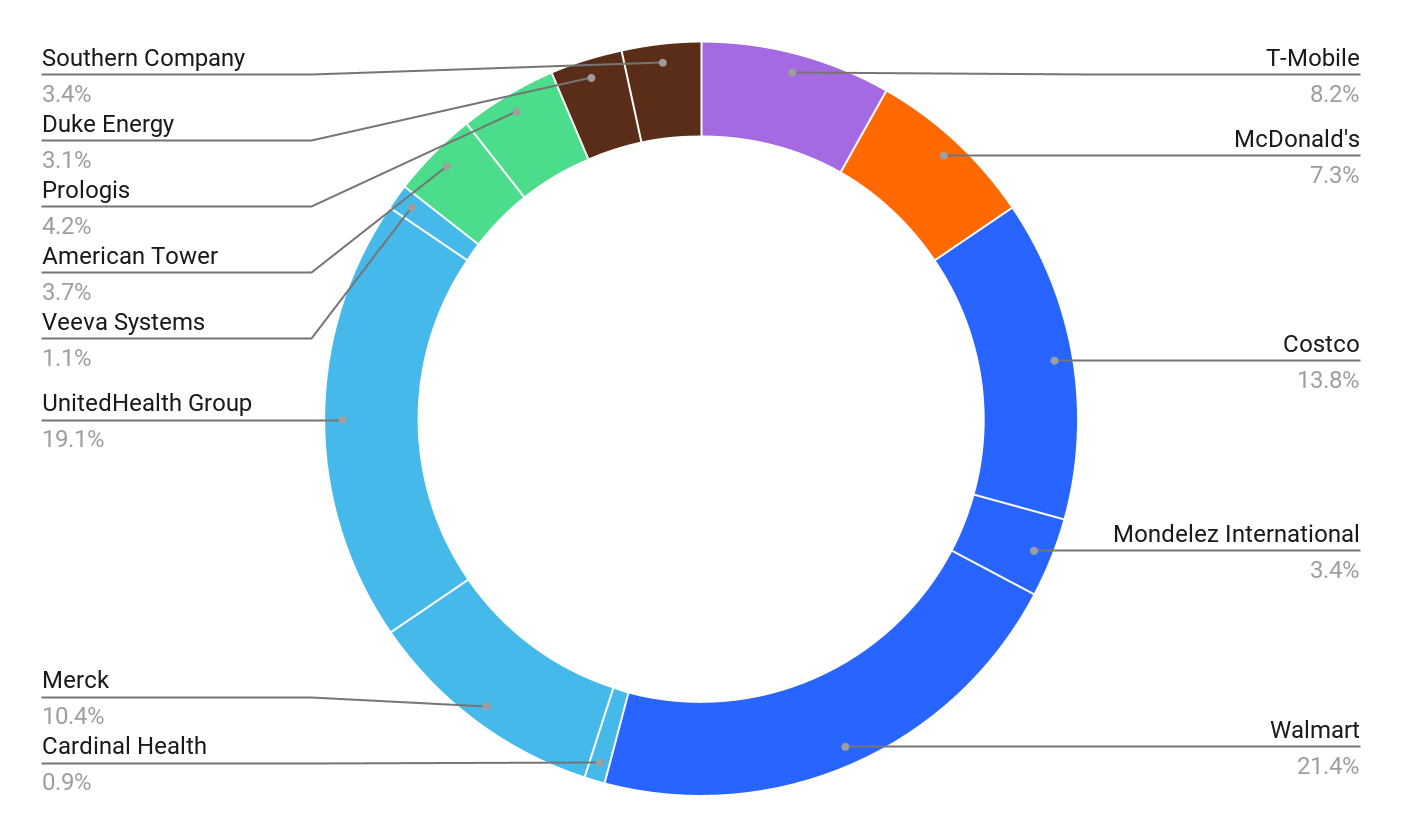
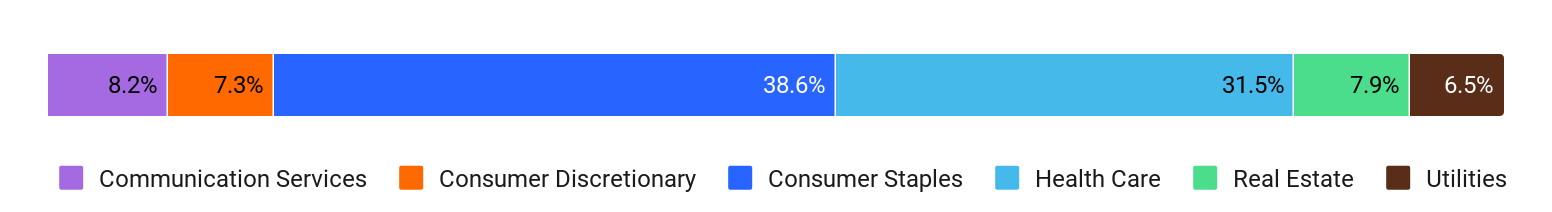
An example of such a defensive play is a portfolio comprising 13 S&P 500 companies that exemplify defensive sectors in the face of a potential economic downturn. The companies with this example are randomly distributed across six GICS sectors: Real Estate (American Tower and Prologis), Health Care (Cardinal Health, Merck, UnitedHealth Group, and Veeva Systems), Utilities (Duke Energy and Southern Company), Consumer Staples (Costco, Walmart, and Mondelez), Communication Services (T-Mobile), and Consumer Discretionary (McDonald’s).
This diversified group of 13 companies, spanning various sectors, is strategically designed to leverage the inherent defensive attributes of each company within its respective industry. Moving forward, we will refer to this portfolio as the DEFENCE portfolio.
Source: Facset
As of 20th August, the total market capitalization of DEFENCE was $2.805 trillion, equivalent to 6.0% of the total market value of the S&P 500 Index.
How have they performed this year?
So far this year the performance of DEFENCE has been mostly positive with 9 of its 13 constituents up, led by Costco at 31.0%, followed by Walmart at 29.7% and Southern Company at 24.4%. The underperforming stocks are McDonald’s at -8.8%, Prologis at -8.0%, and Mondelez at -2.9%.

Source: Facset
How does it compare to the S&P 500?
Our comparative analysis with the S&P 500 extends back to 2018 in order to encompass shocks of diverse nature, while remaining within a timeframe that is still pertinent to current market conditions.
Superior Profitability and Higher Valuations
The DEFENCE portfolio's EBITDA margin has demonstrated a notable increase of 3.9 percentage points since 2018, rising from 29.4% to 33.4%. In contrast, the S&P 500's EBITDA margin has only seen a 0.9 percentage point increase to 20.6% over the same period. Furthermore, the DEFENCE portfolio's EBITDA margin has exhibited stability, consistently remaining above 30% since the third quarter of 2019.

Source: Facset
The increasing profitability of the DEFENCE portfolio is further evidenced by its current EV/EBITDA valuation multiple of 16.5x. This represents a 13.7% premium compared to the S&P 500's EV/EBITDA multiple of 14.5x. However, it is important to note that the DEFENCE portfolio's current premium is considerably lower than its 3-year and 1-year averages, which stand at 17.2% and 27.1%, respectively.

Source: Facset and Exante research.
In terms of absolute returns, the DEFENCE portfolio has significantly outperformed the S&P 500 since 2018, achieving a performance of 125.7% compared to the S&P 500's 109.4%. Notably, during periods of heightened market volatility in 2020 and 2022, the DEFENCE portfolio surpassed the S&P 500 by over 20 percentage points. The average outperformance of the DEFENCE portfolio since 2018 stands at a substantial 10.6 percentage points. Moreover, its current 1-year average outperformance is an impressive 12.4 percentage points.

Source: Facset and Exante research.
From a risk-adjusted perspective, the DEFENCE portfolio's outperformance has been accompanied by lower volatility. Both the 3-year and 1-year average realised volatility of DEFENCE, at 17.4% and 16.8% respectively, are markedly lower than the S&P 500's corresponding figures of 21.4% and 22.1%. Presently, DEFENCE's 1-year realised volatility is at 10.1%, notably lower than the S&P 500's 12.5%.
While the DEFENCE portfolio's current return-to-volatility ratio is higher than that of the S&P 500, at 2.42 versus the index's 2.25, the volatility of its return-to-volatility profile is also lower. This reduced volatility can contribute to the resilience of an investment strategy.

Source: Facset and Exante research.
This trend is further exemplified by the DEFENCE portfolio's 1-year Beta, which has steadily declined since the spring of 2021, decreasing from 0.80 to 0.354 as of today. The inclusion of companies with lower beta values within a portfolio can contribute to stability and enhance risk management during periods of elevated market volatility.

Source: Facset and Exante research.
Summary
While US consumption has been resilient as expressed by official economic data, and in different data sets, this doesn’t necessarily translate into higher sales or higher margins for broad consumer-centric sectors.
Looking beyond financial media headlines, it’s important to understand the drivers of the US consumer to better capture how consumption behaviour can affect specific companies, and for that it’s necessary to look at underlying trends in wage and compensation growth as well as savings across income quintiles, sentiment, consumer credit and different components of inflation. A single economic data point cannot fully capture the complexities of the US consumer ecosystem.
As demonstrated by an example mix of 13 defensive stocks, performance can equal or match that of the S&P 500 and do so with lower levels of volatility and greater resilience. This approach can enhance the risk-return profile of an investment strategy by prioritising risk management.
It is crucial to recognise that a portfolio's Beta is not constant and evolves over time. Regular monitoring of the portfolio's beta provides a clearer understanding of the diversification its constituents contribute to the overall investment strategy.
Finally, when assessing a portfolio’s return-to-vol ratio, it’s important to be cognizant of the coefficient of variation for this ratio, given a higher ratio can also be indicative of implicit higher volatility.
While every effort has been made to verify the accuracy of this information, EXT Ltd. (hereafter known as “EXANTE”) cannot accept any responsibility or liability for reliance by any person on this publication or any of the information, opinions, or conclusions contained in this publication. The findings and views expressed in this publication do not necessarily reflect the views of EXANTE. Any action taken upon the information contained in this publication is strictly at your own risk. EXANTE will not be liable for any loss or damage in connection with this publication.
This article is provided to you for informational purposes only and should not be regarded as an offer or solicitation of an offer to buy or sell any investments or related services that may be referenced here.